Grafana
Grafana AI is AI grounded in the systems and signals you already trust, not a chatbot bolted onto an observability product.
It is built on the same open, proven platform teams already use to store, explore, visualize, and act on production data.
Built on open observability foundations
Before an agent can explain what is happening, the underlying platform has to collect the right signals, keep them queryable at scale, and preserve the context that makes them useful. Grafana AI starts there.
- Grafana provides the dashboards, visualizations, alerting, access controls, and plugin platform where people already investigate their systems.
- Mimir stores Prometheus metrics at scale.
- Loki makes logs searchable and connects them to the rest of the incident story.
- Tempo stores distributed traces and links a slow request to the services and spans behind it.
- Pyroscope adds continuous profiles, so an investigation can reach the code consuming CPU or memory.
- Alloy collects and routes metrics, logs, traces, and profiles with OpenTelemetry and Prometheus compatibility.
These are not separate silos presented to an LLM. Grafana correlates the signals, dashboards, alerts, service relationships, and ownership context. Assistant works from that shared operational picture.
The next generation of signals
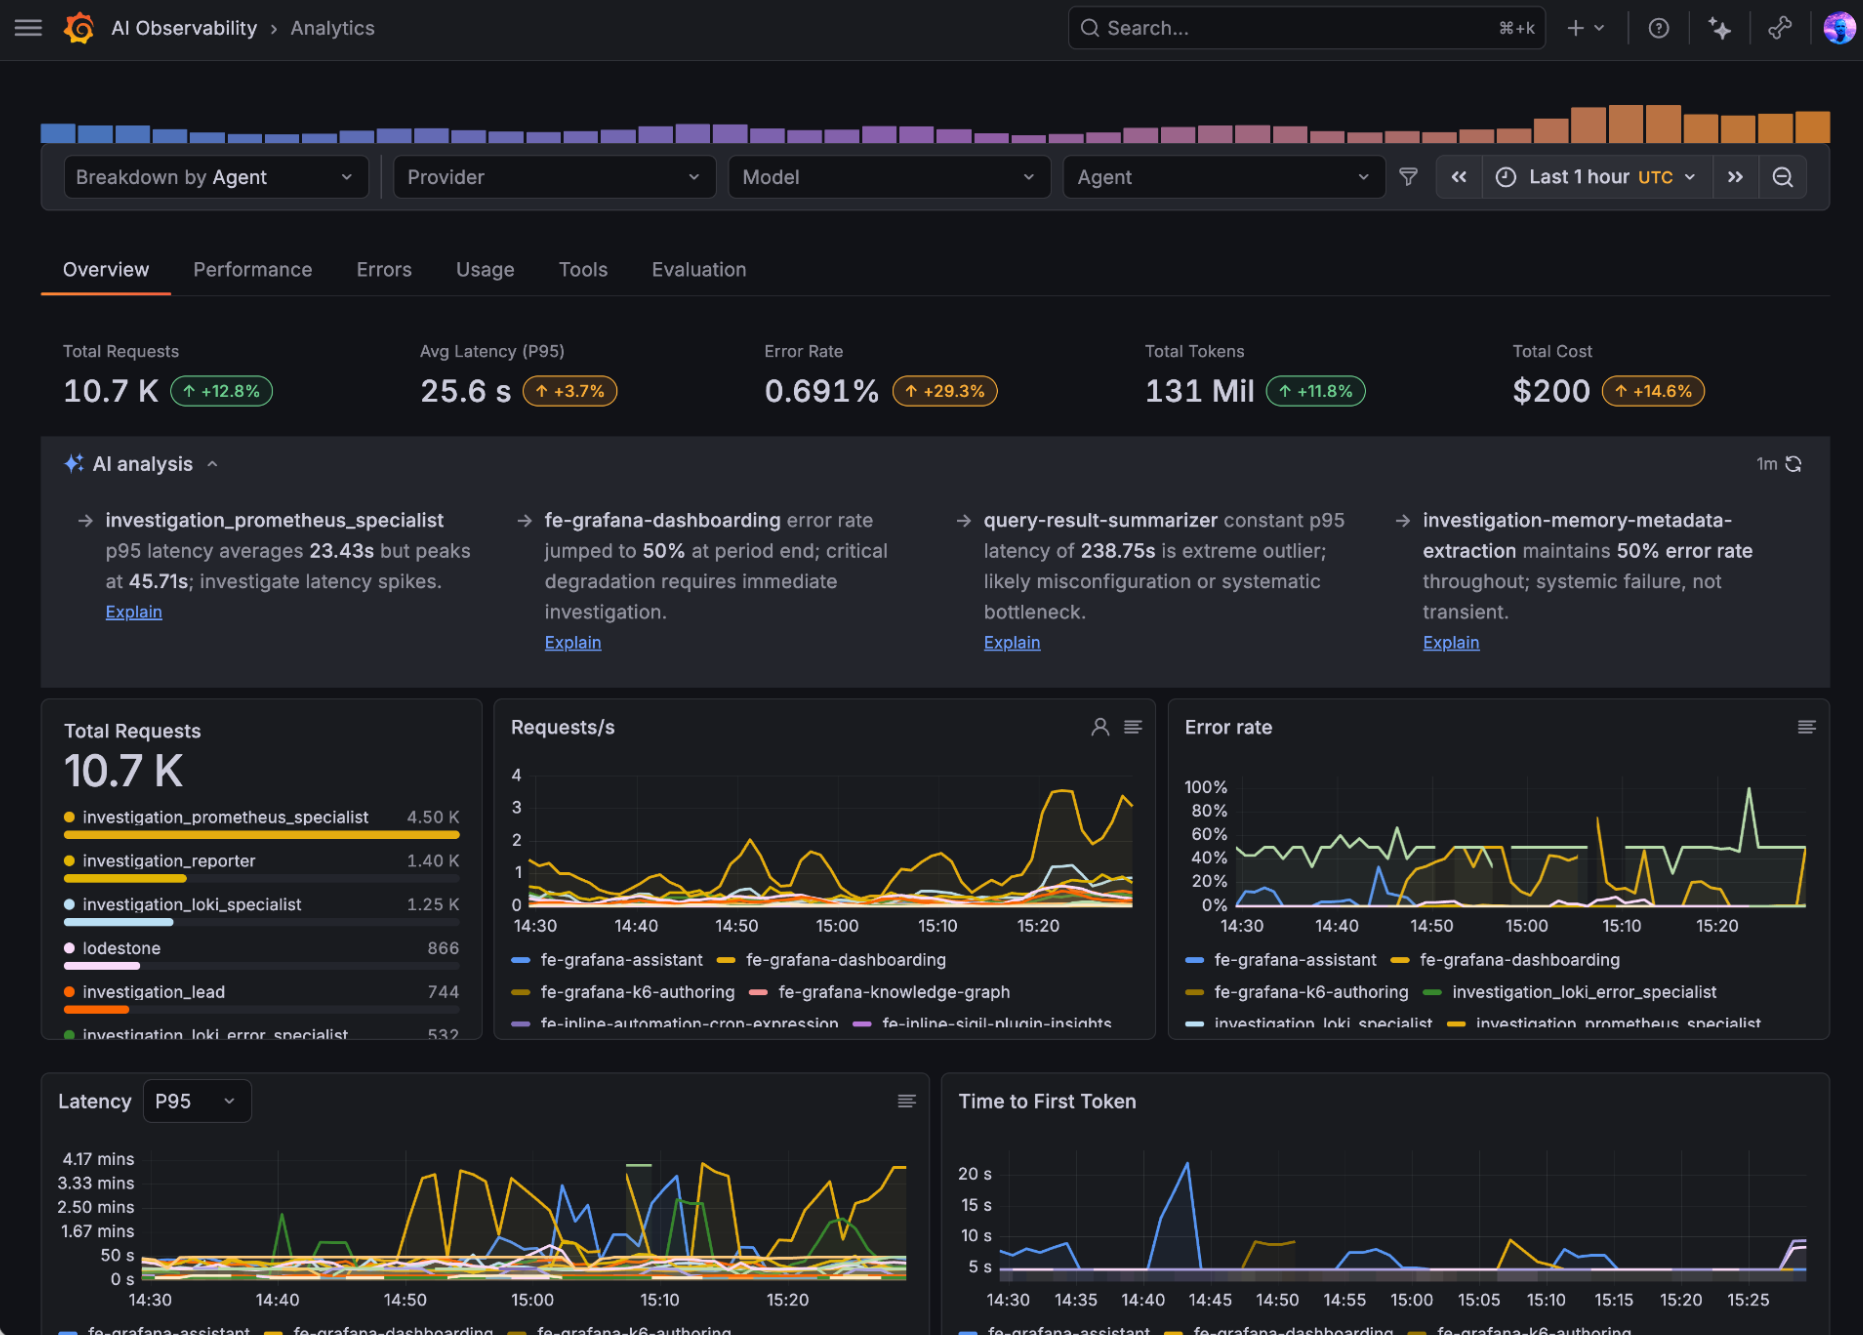
Metrics, logs, traces, and profiles explain software. Agents also produce a new class of operational evidence: conversations, generations, tool calls, workflow steps, model versions, tokens, costs, ratings, and evaluation scores.
Grafana AI Observability treats those agent signals as first-class telemetry. Its SDKs capture generation data while OpenTelemetry carries traces and metrics through the same collection path used by the rest of your estate. You can move from a latency or cost change to the exact conversation, tool call, or failed evaluation behind it without leaving Grafana.
One Assistant across Grafana
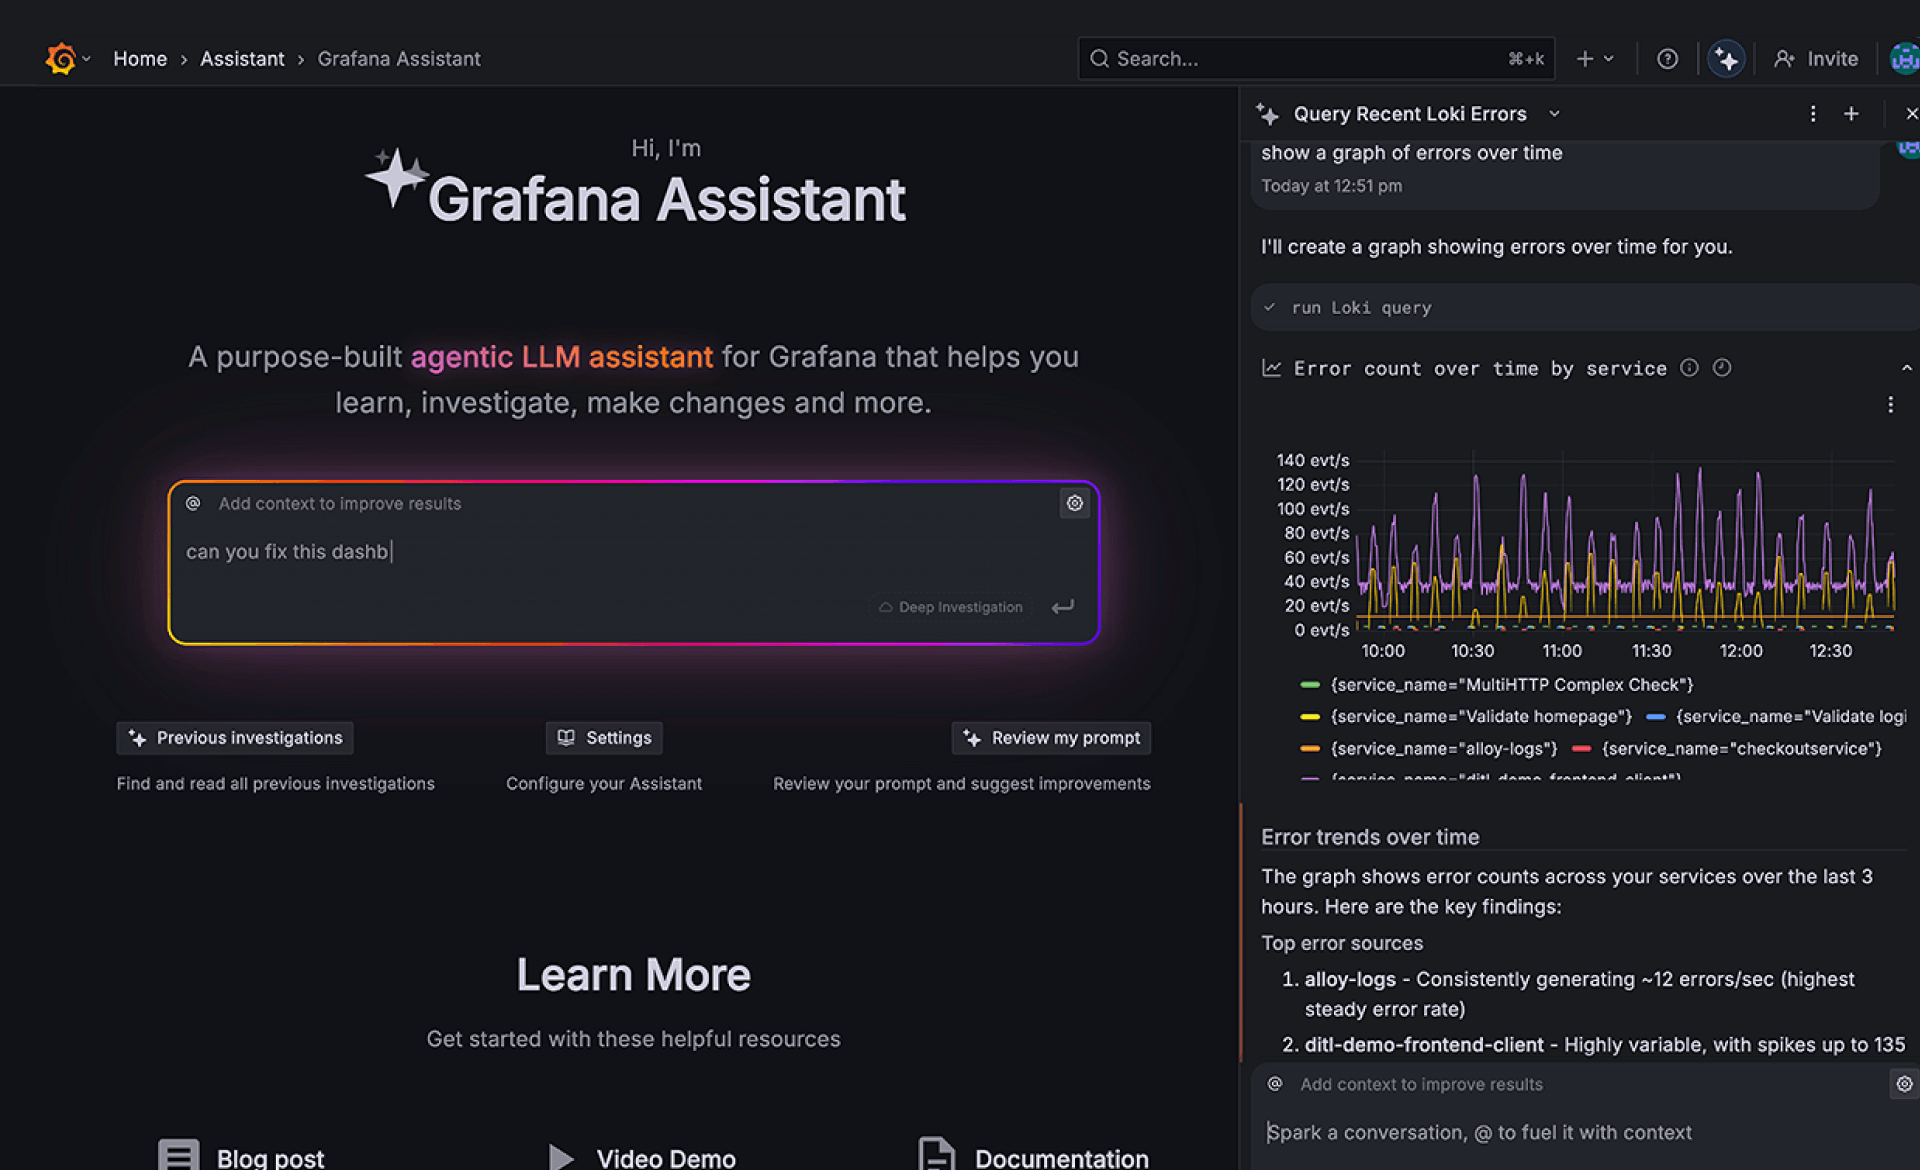
Assistant stays with you as you move through Grafana. It receives the context of the current page, respects the permissions of the signed-in user, and can carry what it learns from one signal or app into the next step.
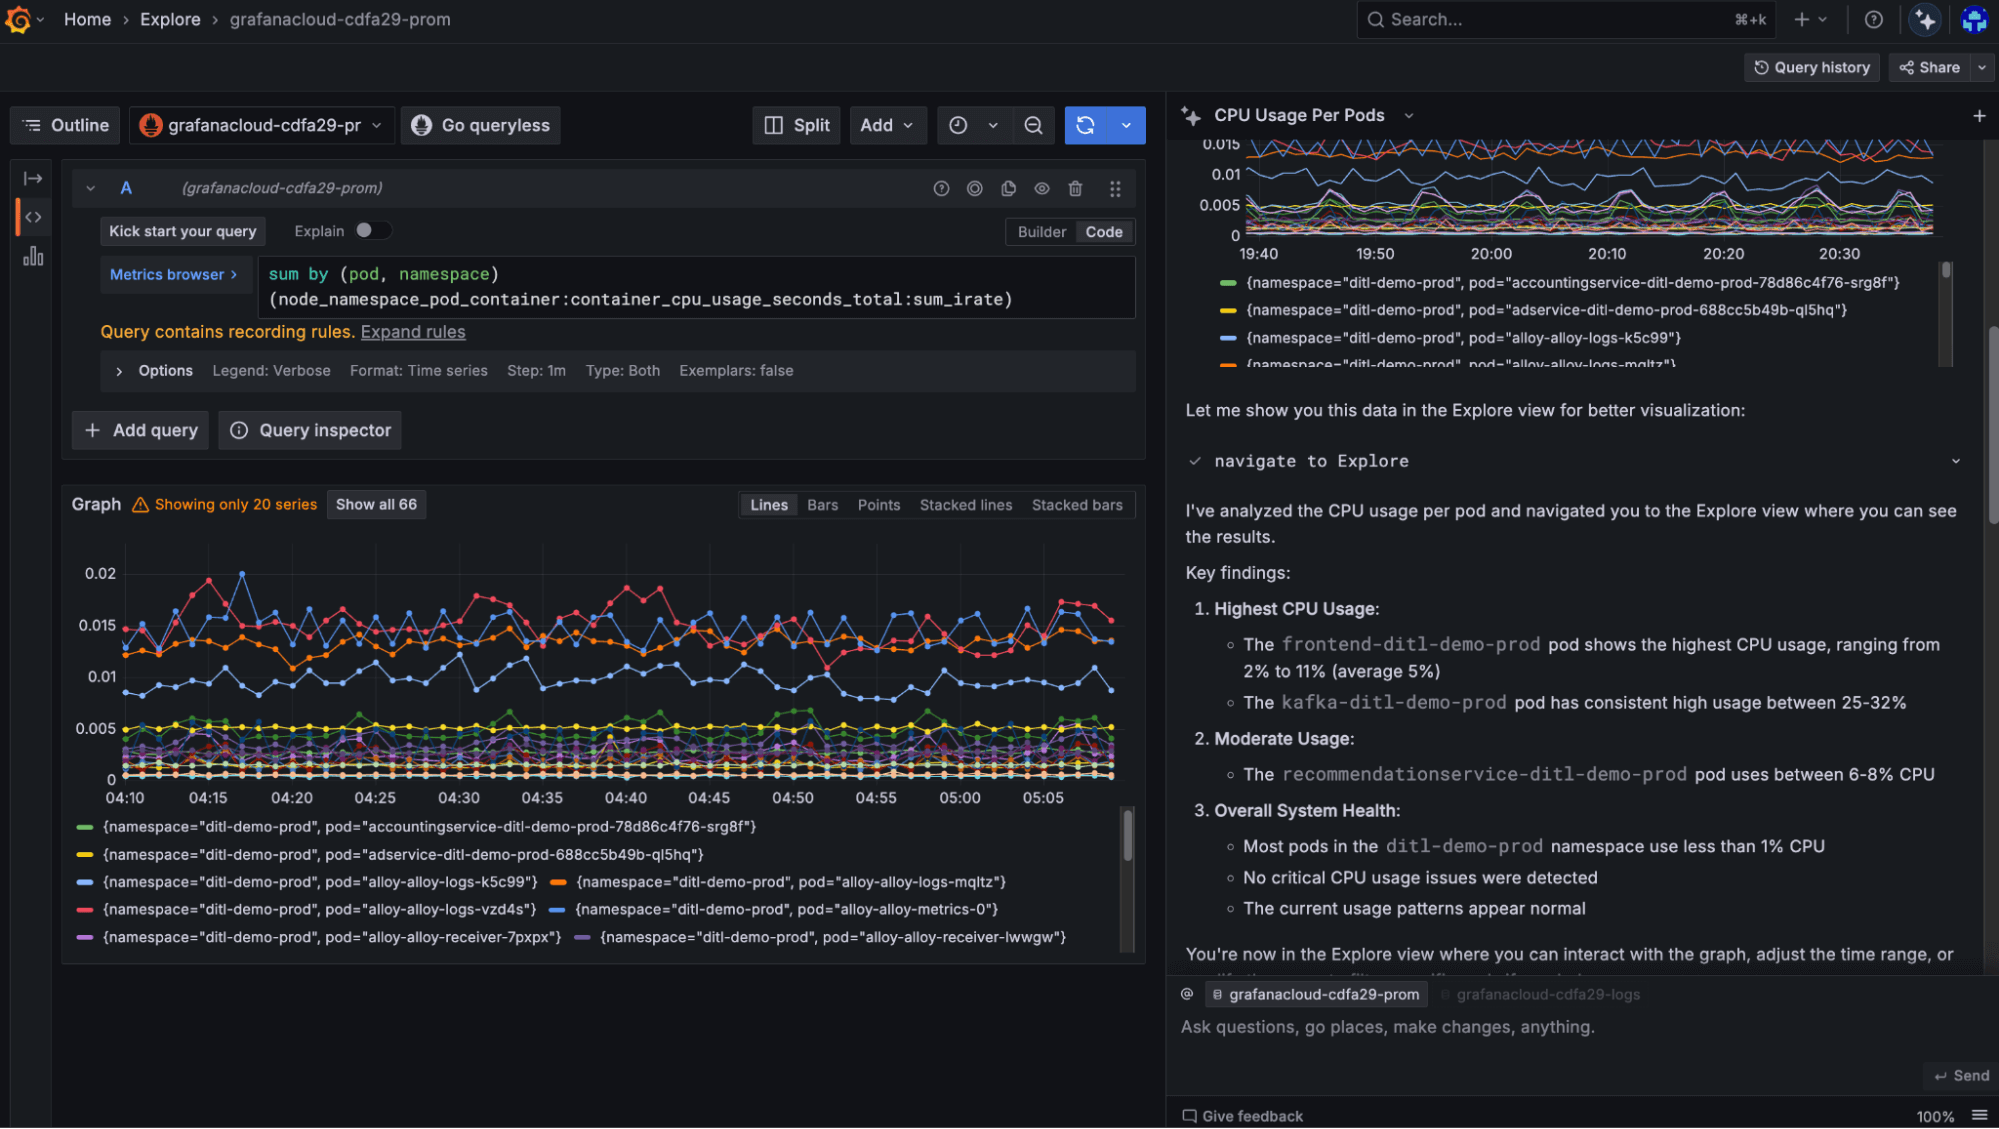
- Explore and Drilldown: query and correlate metrics, logs, traces, and profiles without losing the thread of an investigation.
- Dashboards: create dashboards, explain or repair a panel, make bulk edits, and use an existing dashboard as explicit context.
- Application and infrastructure apps: work with Application Observability, Kubernetes Monitoring, Frontend Observability, Synthetic Monitoring, and the services and dependencies they expose.
- Reliability and response: inspect alerts, create or review SLOs, launch multi-agent investigations, and move into incident-response workflows.
- Performance testing: use k6 Script Authoring to turn a plain-language scenario and live service context into a reviewable load test.
- Knowledge Graph: understand service relationships, diagnose missing connections, and use live topology to ground the next query.
- AI Observability: investigate an agent's behavior with its conversation, traces, tools, costs, and evaluations in view.
The same Assistant also reaches beyond the Grafana UI through Slack, Microsoft Teams, APIs, MCP-connected tools, and the gcx command line. It is one agent working from the same Grafana context, not a collection of unrelated chat experiences.
Panels make answers verifiable
When Assistant makes a claim about your telemetry, it can return the generated query and render the result as a real Grafana panel. You can see the time range, series, labels, thresholds, and shape of the data for yourself.
That matters because a confident paragraph is not evidence. A panel gives you something inspectable: open the query, change the time range, filter a label, compare another signal, or add the result to a dashboard. Assistant does the analysis, but Grafana keeps the path back to the underlying data visible.