Agents have changed engineering. Now they’re changing operations.
With Grafana Assistant and Assistant Investigations, we see fewer incidents, and when they happen the resolution is faster.
Alessio Paccoia, Head of Technology, Cubbio.io
The best AI Agent I used to date has to be Grafana’s Assistant. It built me full custom dashboards in minutes that would otherwise take a Data Analyst many hours to build.
Akvn (@0xAkvn), Platform Engineer
We spend about 5 to 6 people on a call for 3–4 hours… whereas Grafana Assistant gave me all that analysis in about 10–15 minutes.
Director of SRE at a security company
Grafana Assistant across the lifecycle
Level up your team,from plan to production.
Put Grafana Assistant in every stage of the software development lifecycle (plan, build, ship, run) and high-quality operations stop being a specialist’s job. They’re everybody’s.
Many ways to work with Grafana AI, all grounded in the same live telemetry.
Grafana Assistant
Get the answer without learning the query language
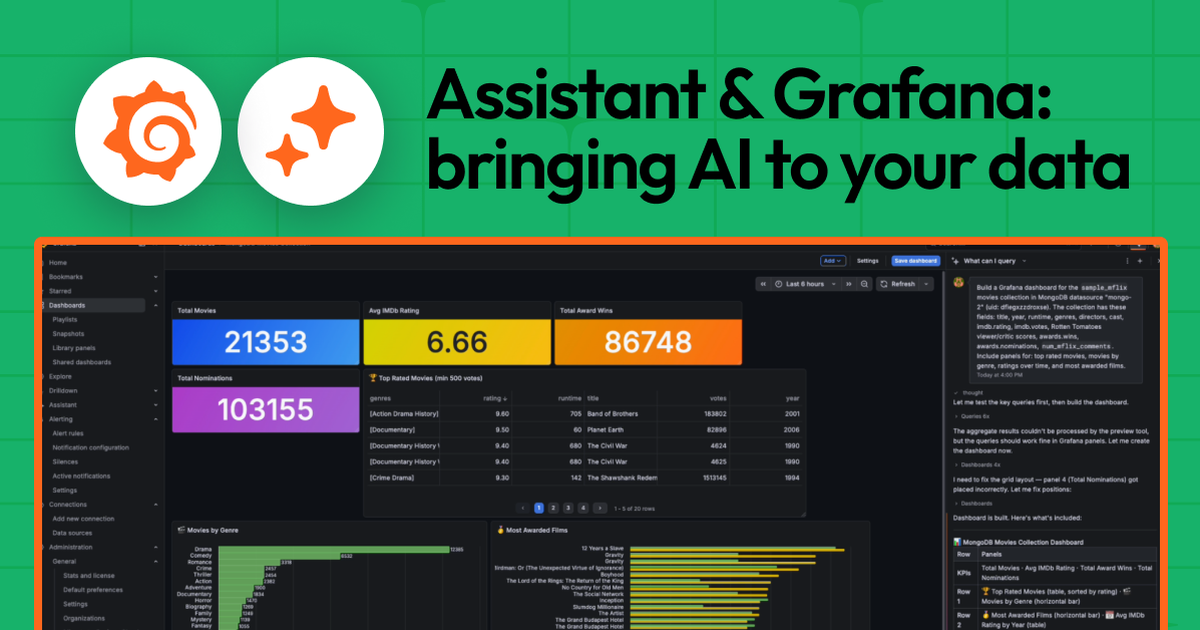
Ask in plain language: no PromQL, no menu-diving. Get back a query you can read and run, a dashboard, or a service explained, grounded in your telemetry, not a general model’s guess.
Automatically investigate issues like never before
Start from an alert or a hunch. Get back the likely causes, ranked, with the metrics, logs, and traces behind each one, so you validate a hypothesis instead of hunting for one.
“I’ve had cases where it cut my time drastically: correlating backend errors and traces to specific front-end page IDs would have taken me hours, but with Assistant Investigations it was a 15-minute task.”
Know what your agents did, not just what you asked them to do
See what your production agents actually did: replay the conversation, track latency, cost, and token use, and confirm each run stayed inside its guardrails instead of trusting that it did.
Reach production telemetry without leaving the terminal
Bring Grafana AI to your terminal and pipelines. Inspect telemetry and apply rules from scripts and CI, and get back reviewable work, not a black-box commit.
Grafana AI is an open agent platform: bring it into Slack and Microsoft Teams, and drive it from the agents and editors you already use. Ask from a Slack thread and get an answer grounded in the same telemetry Assistant sees in-app, whether or not your team has standardized on a coding agent.
Grafana Assistant lives inside Grafana Cloud. Describe a symptom, a service, or a dashboard you want — it turns plain language into queries, panels, and next steps, and shows its work. No install, nothing new to run.
Editorial design demo: manually maintained, no data sources. Scroll-driven hero recreating the
capsule.video interaction pattern with the Make-Shift font-stretch wave on a variable-width font.
Lifecycle section copy mirrored from the grafana.ai dev-site homepage; card layout after Framer’s “From design to deploy, together” grid. Product bands (copy + CSS art) ported from grafana-ai.grafana-dev.net; nav, logo and hiring band from the gai-proto-g prototype page. Owner: Bogdan Racles · Marketing · Generated: 2026-07-16 · Update frequency: Static